

Decoding the US Dollar: Insights for Precious Metals Investors


Tonight we’ll focus our attention on the PM complex and the US dollar, as they go hand in hand. Generally, but not always, there is a pretty strong inverse correlation between the US dollar and the PM complex. When the US dollar goes down, the PM complex generally goes up, and vice versa. If we get the direction of the US dollar right from the short to long term, it can make our job much easier to know what is going to take place in the PM complex.
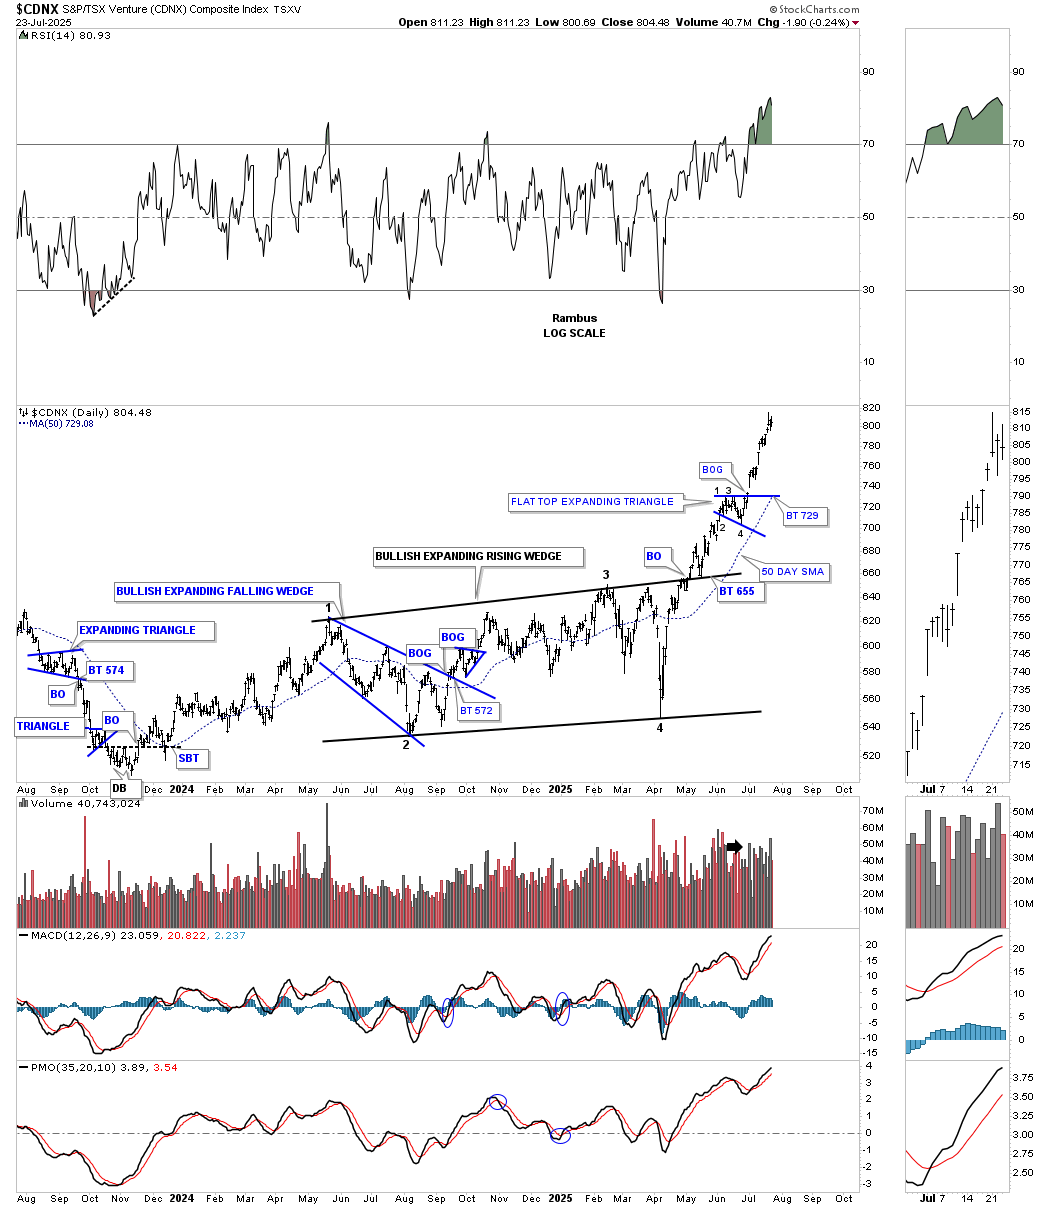
Let’s start with the daily chart for the CDNX, where many of the junior and micro-cap PM stocks are located, which is also where many of the 10 and 20 baggers will be found. After putting in the 4th reversal point in April of this year, for the one-year bullish expanding rising wedge, the CDNX has been on fire, forming just one small consolidation pattern, the blue flat-top expanding triangle.
Going back further in time, the last right shoulder low on this simple weekly chart is the same low on the daily chart above at the 4th reversal point. Note how the neckline symmetry line showed us where to look for the right shoulder lows for the double H&S bottom. The reverse symmetry to the upside over the same area on the way down, as shown by the black arrows, is starting to get a bit extended, which could lead to another small consolidation pattern, but until then the bulls are fully in charge.