

PM Complex: A Year in Review.

With gold’s near-parabolic rise to $3500 this month, let’s look at the PM complex to see how they may fare if gold has put in a short-to-intermediate-term high and begins to consolidate. We’ll also look at some before-and-after charts from roughly a year ago and see how the PM complex has progressed, and we’ll finish up by looking at some ratio charts.
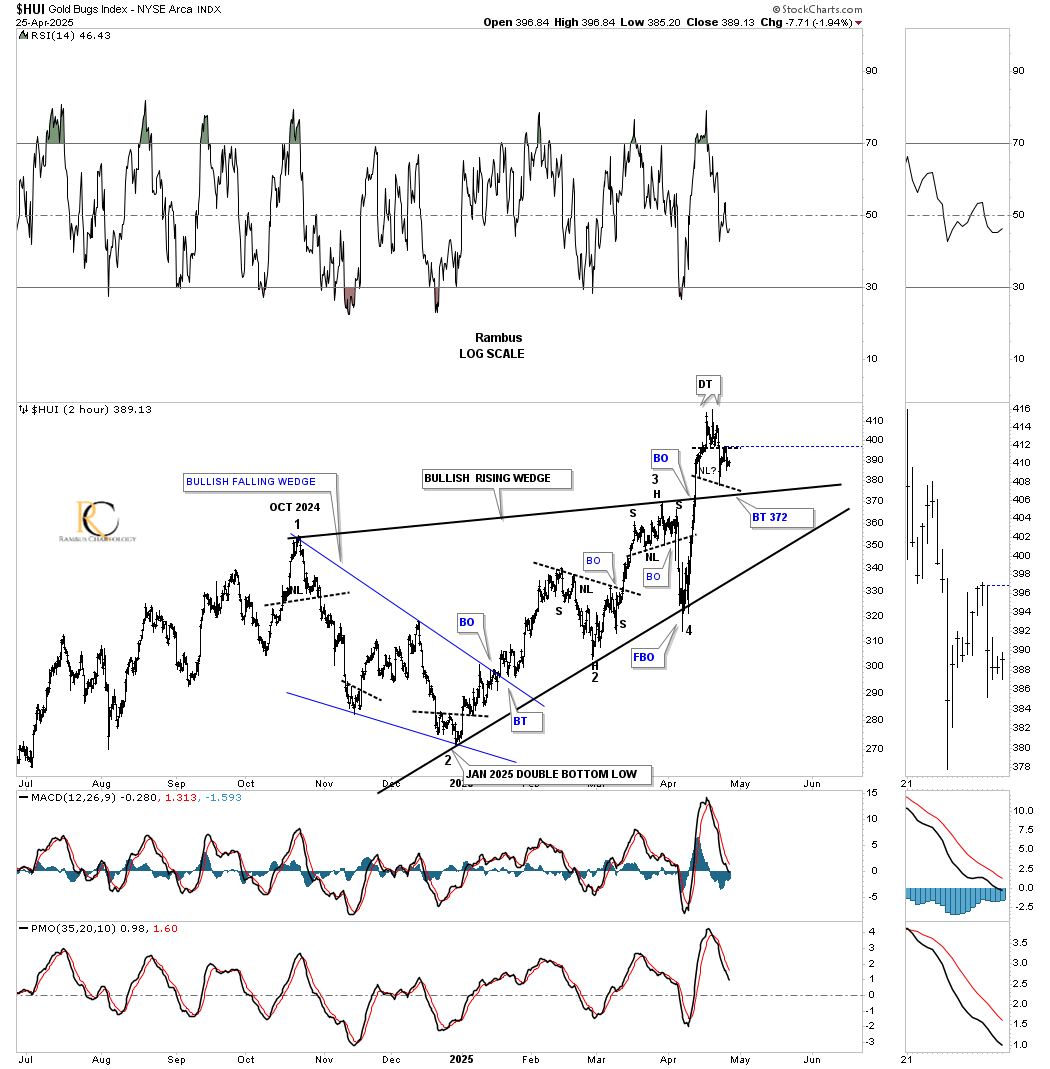
Up first tonight is a 2-hour chart for the HUI, which shows all the small trading ranges it has formed since the October 2024 high, which we were able to recognize in real-time as they were forming. Small chart patterns like most of these can be hard to spot in real-time, but knowing the direction of the PM complex can help us understand what patterns may be forming.
Focusing on the most recent high, we can see a micro double top that may be forming the head of a slightly larger H&S top. It’s essential to keep in mind that the possible small H&S top won’t be confirmed until the neckline is broken, so what may look like an H&S top could be just the beginning of a sideways trading range at this point.

This second 2-hour chart shows the potential bullish rising wedge, which the chart patterns on the chart above formed without the top and bottom trendlines. Now you can see how that possible micro double top/H&S top is forming, just as a possible backtest to the top rail of the October 2024 bullish rising wedge. The thing about a bullish rising wedge is that they show up in a strong impulse move, so there shouldn’t be much time in backtest mode before the impulse move begins in earnest once again. Any hesitation of duration could be a sign that the pattern may be failing, so this week is going to be critical.
Stepping back even further in time, the potential bullish rising wedge looks authentic with the breakout and now backtest taking place. What we don’t want to see is for the HUI to trade back inside the rising wedge, as that would show a false breakout and possible bear trap, but so far, so good.