


Secular Bull Market Rally or Melt-Up Phase: Decoding the Current US Stock Market Trend

Before we look at tonight’s charts, I would like to discuss one important adage that I learned through the years, and that is, “WE ARE PLAYING A GAME OF PSYCHOLOGICAL WARFARE MORE THAN ANYTHING ELSE.”
As investors in the markets, every day we are bombarded by countless news stories, which can be both positive or negative, that subconsciously play a key role in how we view the markets. It’s easy to say the news doesn’t affect me, but after a period of time, it becomes harder and harder to separate oneself from what is true from what is just noise, which can make it hard to draw an objective opinion.
Many investors will seek out news stories and analysts that only agree with what they think is true, thereby they have a biased perspective instead of an open mind. I know for a fact that most PM investors believe the stock markets have to crash and burn in order for the PM complex to have a bull market. If that is a fact, then why are both gold and the SPX trading close to their all-time highs at the same time, with most of the PM stock indexes trading at a 13-year high?
The US stock markets are another perfect example of how negative news stories can close one’s mind to what is reality. They call it, “THE WALL OF WORRY.” The more one reads on how bad things are and are going to get, the more entrenched they become in their negative view of the stock market, not seeing the forest for the trees. The markets are forward-looking by six to ten months, so while most investors are focused on the present, what the markets are seeing six to ten months out could be totally different from the present. This is the reason why everything you read at an important low is bearish and bullish at market tops, “PSYCHOLOGICAL WARFARE.”
Since we’ve been covering the PM complex pretty exclusively, I would like to take a slight detour this week and look at the stock markets, where there are many bullish patterns under construction, which can be just as lucrative as the PM complex if one can keep an open mind.
Before we do, I would like to update silver and its potential bullish diamond consolidation patterns.
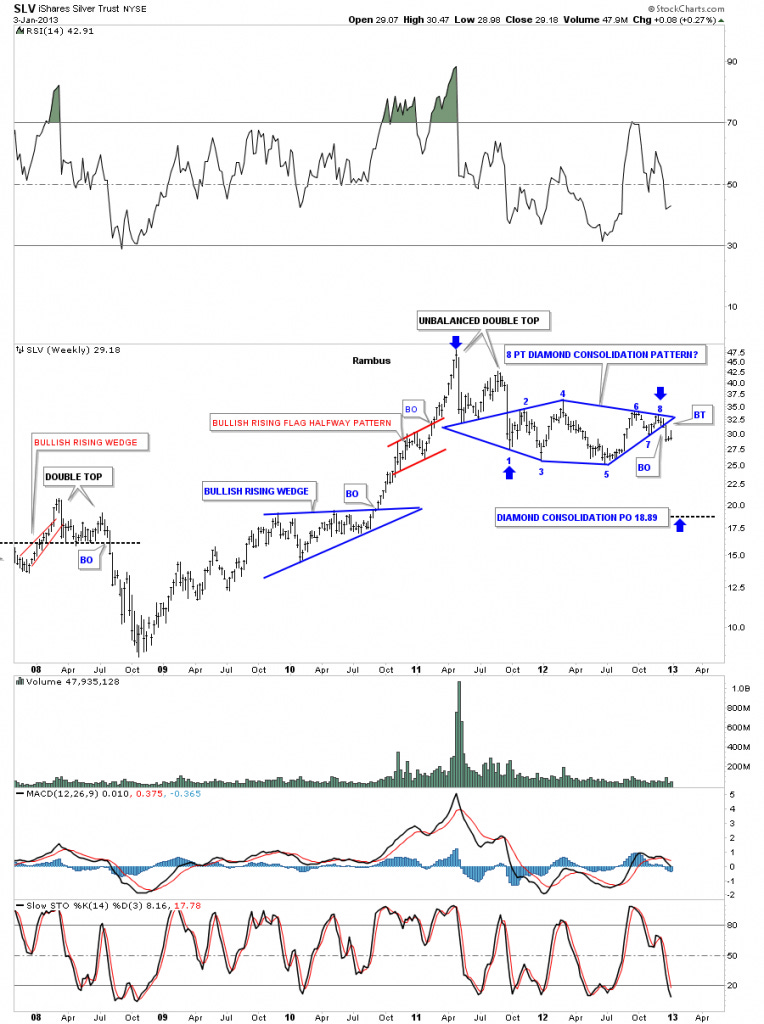
Silver is no stranger when it comes to building diamond consolidation patterns. Shortly after the 2011 bull market top, SLV formed a very diamond consolidation pattern, which completed with eight reversal points.
Back in the early days of Rambus Chartology, Fullgoldcrown used to be my editor and would take interesting charts and highlight them. Below is a weekly chart for SLV, which shows the final bull market rally into the 2011 top. What formed as the first consolidation pattern in the new bear market was the very symmetrical 8-point diamond consolidation pattern. Fullgoldcrown comments on January 3, 2013.
Editor’s Notes:
There is a history of diamonds and silver at Rambus Chartology that needs to be seen here.
Here is a call on silver (via SLV) that I couldn’t believe at the time: “SLV BLUE DIAMOND.”
Next is the November 7, 2013 update showing a second red diamond.
Followed soon after by “SLV RED DIAMOND.”
See that Price Objective (PO) of the Red Diamond? Prediction made November 2013 for 14.50… Which is very close to where SLV bottomed (14.64) in November 2014. (The ultimate bottom was lower at 13).