


Wednesday Report… A General Update On The Markets


With it being another slow day in the PM complex, we’ll go through some of our regular charts and then I’d like to show you some charts for BTCUSD. I don’t post many charts on BTCUSD because investors either love it or hate it, which is understandable because it’s relatively new. For me personally, it’s just another trading vehicle that produces some great Chartology.
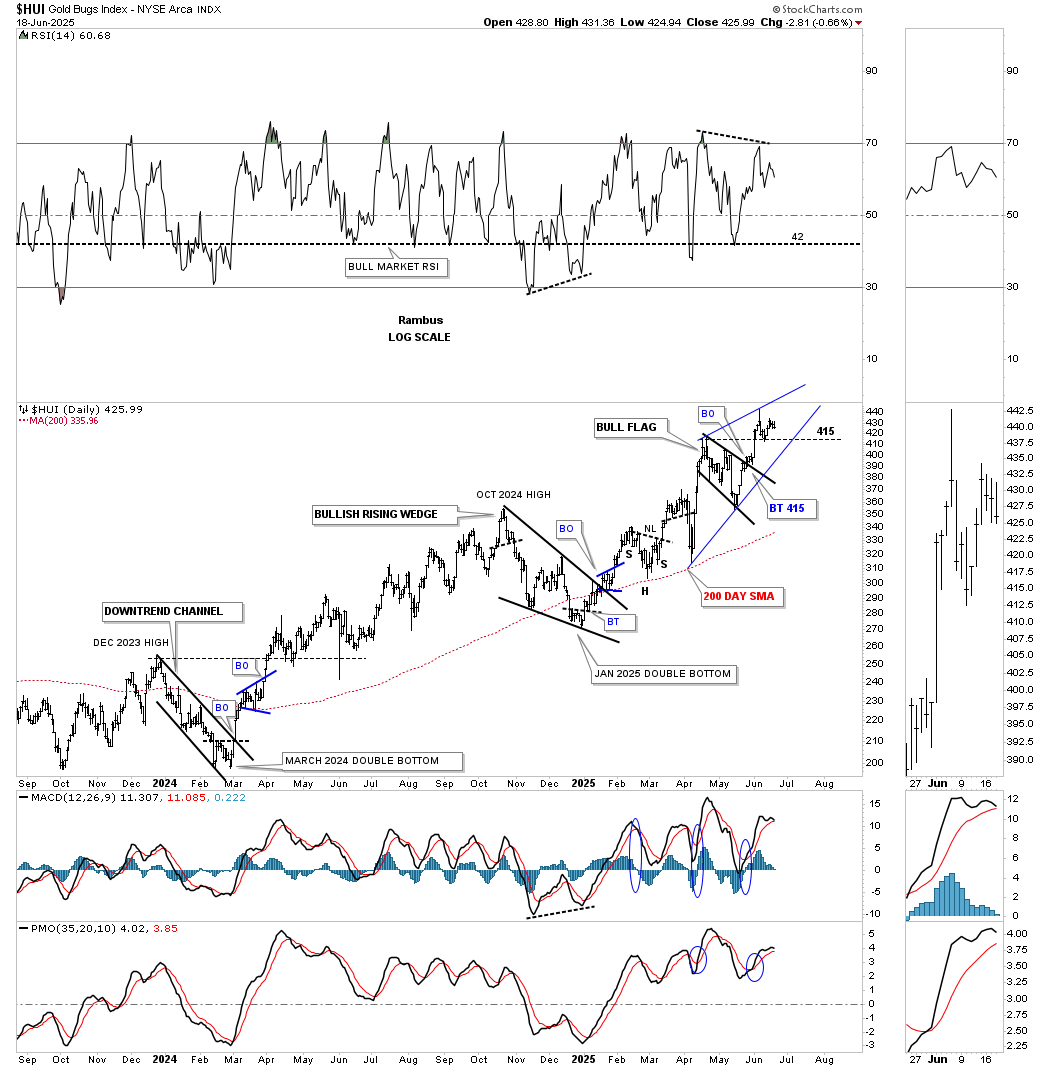
Let’s start with the short-term 2-hour chart for the HUI, which shows the most recent bull flag that we’ve been debating whether it’s going to be a standalone pattern or part of a larger consolidation pattern. The recent breakout above the top of the bull flag at 415 suggests it’s a standalone consolidation pattern, but it won’t be confirmed until the most recent high is exceeded.
From this short-term perspective, it could trade sideways above 415 until it hits the bottom rail of the lower blue uptrend line, which would show a rising wedge. In the short term, the two thin blue up-sloping trendlines are defining the price action.
This next combo chart is a longer-term weekly look at the PM complex and shows the May 2022 six-point triangle consolidation patterns we were following very closely during its development. After the breakout, the PM stock indexes rallied higher, forming the October 2024 bullish rising wedge in most cases. If you recall, we got a nice clean breakout, but with a strong backtest, which put in a little doubt about its validity.